SAHIL ALI - PORTFOLIO
Project 2
Bansal Supermarket Sales Analysis Tableau
Analysis of sales data from Bansal Supermarket to identify trends and improve decision-making.
Project Overview
This project analyzes sales data from Bansal Supermarket to derive actionable insights for inventory management, pricing strategies, and sales optimization. As a GRN Officer at Bansal Supermarket, I leveraged my experience to interpret the data and provide relevant recommendations.
What I Did in This Project
- Collected and cleaned sales and inventory data from Bansal Supermarket’s retail software.
- Analyzed item-wise sales and profit performance to identify top-selling and most profitable products.
- Created interactive Tableau dashboards to visualize sales vs. profit, category contributions, and profit by item.
- Compared product categories (Food vs Non-Food) to highlight revenue drivers and optimize inventory focus.
- Calculated profit margins and stock turnover rates to recommend pricing and inventory improvements.
- Summarized actionable insights for management, including which items to promote and where to reduce losses.
- Presented findings using clear charts for easy strategic decision-making.
Bansal Supermarket Dashboard: Insights & Visual Analysis
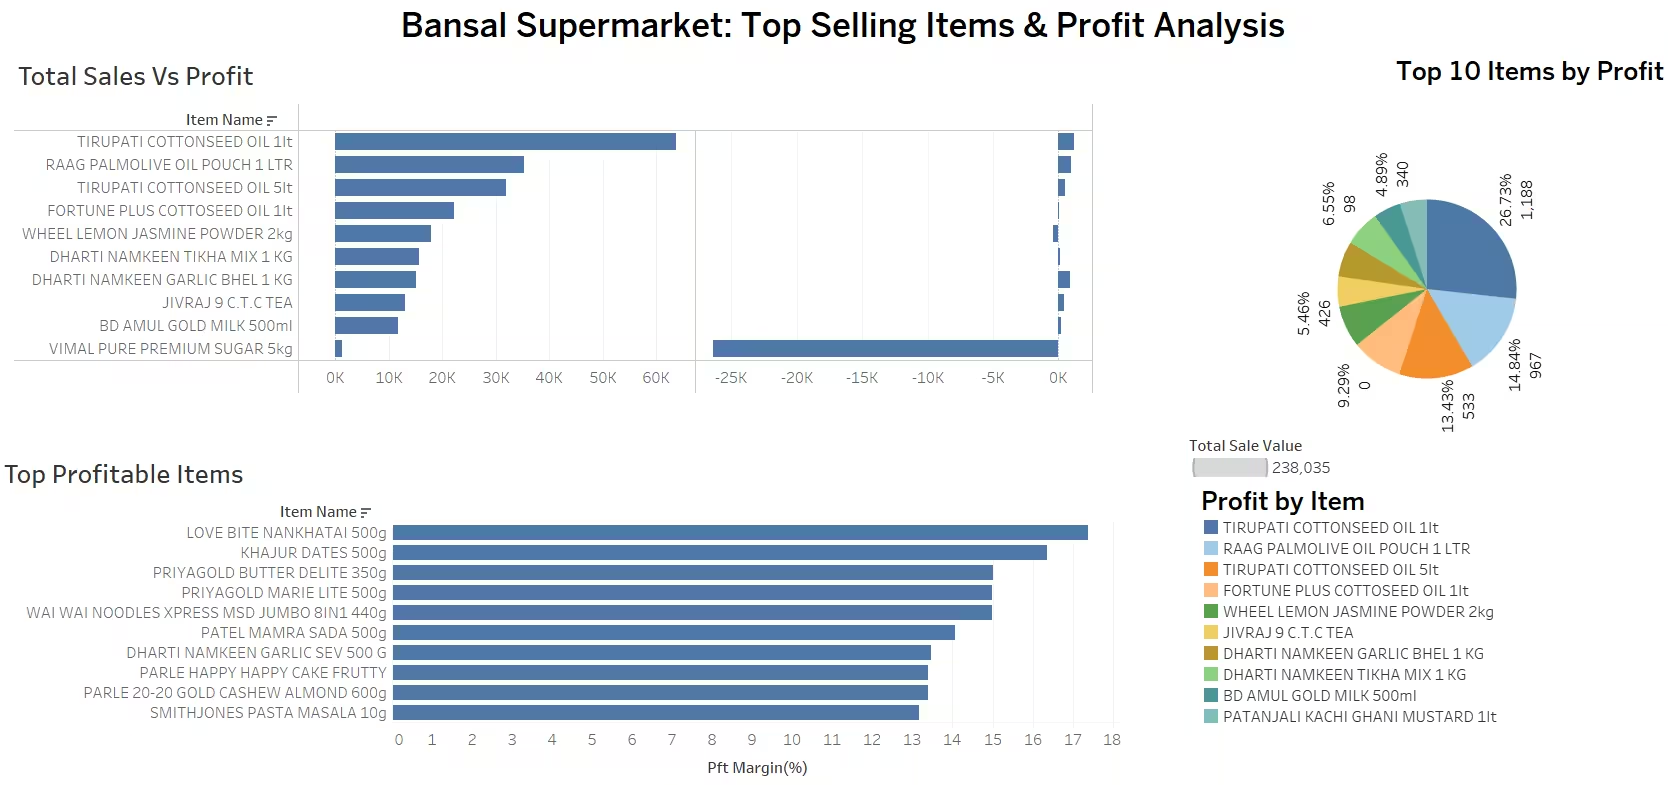
Dashboard overview: Top selling items, profitability, and key metrics visualized from Bansal Supermarket sales data.
Main Code: Food vs Non Food
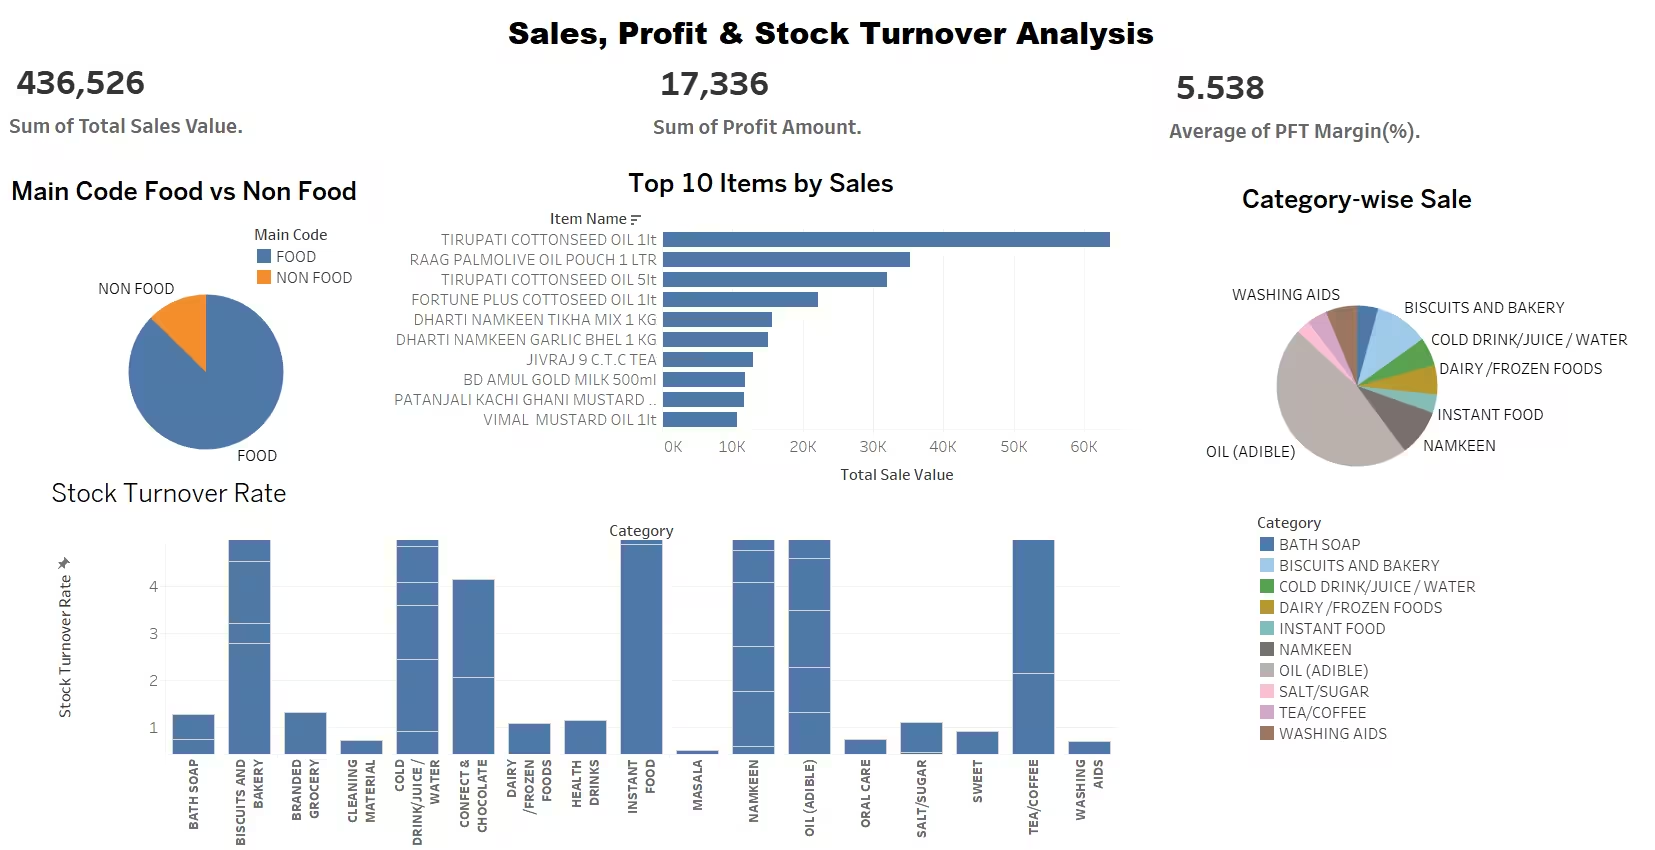
This pie chart shows the proportion of sales from Food and Non-Food categories, highlighting the dominant segment.
Top 10 Items by Sales
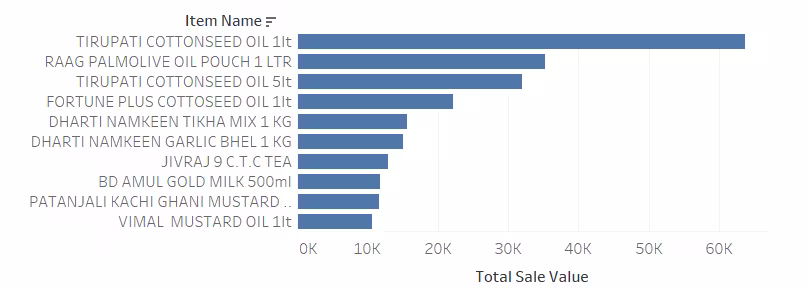
This bar chart displays the top 10 best-selling items, allowing focus on high-demand products.
Stock Turnover Rate by Category
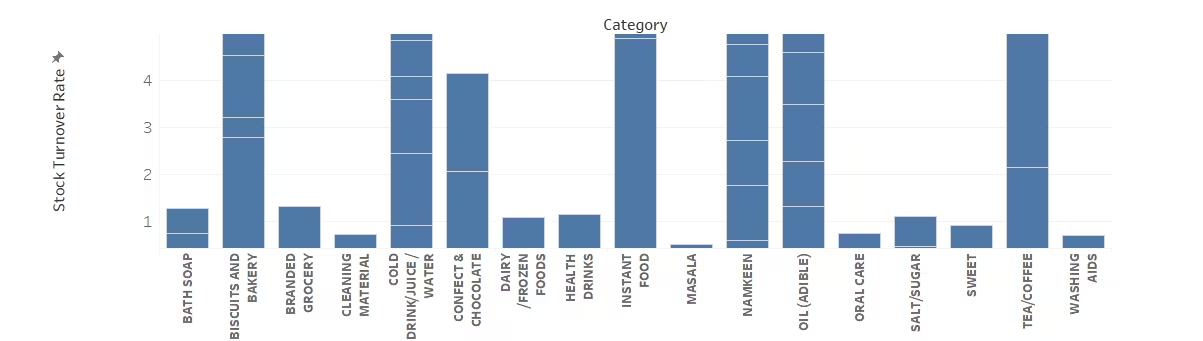
This chart shows how quickly inventory turns over in each category, indicating efficiency in stock management.
| Item Name | Category | Total Sale Value (₹) | Profit Amount (₹) | Profit Margin (%) | Stock Turnover Rate |
|---|---|---|---|---|---|
| TIRUPATI COTTONSEED OIL 1lt | OIL (EDIBLE) | 63,636 | 1,188 | 1.87 | 1.21 |
| RAAG PALMOLIVE OIL POUCH 1 LTR | OIL (EDIBLE) | 35,326 | 967 | 2.74 | 1.09 |
Insights and Recommendations
- TIRUPATI COTTONSEED OIL 1lt is the highest-selling product but has a low profit margin, indicating a volume-driven strategy.
- LOVE BITE NANKHATAI 500g has the highest profit margin, suggesting potential for focused marketing.
- Promote high-margin products more aggressively to improve overall profitability.
- Monitor stock turnover rates to optimize inventory and reduce holding costs.