SAHIL ALI - PORTFOLIO
Project 4
Daily Cash Flow Dashboard: Multi-Store Retail Analysis Power BI + Google Sheets
Automated daily cash tracking for two retail stores, reducing errors and enabling real-time financial decisions.
Overview:
Developed a robust daily cash flow management system for two retail stores by integrating Google Sheets (for data entry) with Power BI (for visualization and analysis). This solution automates daily tracking of cash inflows, outflows, deposits, and discrepancies, providing real-time insights for better decision-making.
- Automated data import from Google Sheets to Power BI for real-time dashboard updates.
- Daily tracking of sales, expenses, coin additions, and deposits for each store.
- Dynamic calculation of opening/closing balances, shortfall/excess, and cash left in drawer.
- Custom Power BI dashboards for trend analysis, store comparisons, and anomaly detection.
How Daily Cash Flow Works:
1. Opening Balance:
At the beginning of each day, the cashier starts with an Opening Balance from the previous day's closing balance. This amount is carried over and represents the cash available to begin the day’s operations.
Example: If yesterday’s closing balance was ₹5,000, this becomes today’s opening balance.
2. Cash Sales:
Throughout the day, as customers make cash purchases, the cashier records the amount. This cash is added to the Opening Balance to calculate the total cash available for the day.
Example: If today's cash sales total ₹8,000, then the total cash available becomes ₹5,000 (opening) + ₹8,000 (sales) = ₹13,000.
3. Expenses (Store and Staff Payments):
The store incurs daily expenses such as rent, electricity, and staff payments. These are deducted from the total available cash.
Example: If store expenses are ₹2,000 and staff payments ₹3,000, then ₹5,000 is deducted from the total cash available.
4. Closing Balance:
After all expenses, the remaining cash is the Closing Balance — the final amount at day's end, ready for deposit or carryover.
Example: If, after deducting ₹5,000 in expenses, ₹8,000 remains, this is the closing balance.
5. Deposit:
At day's end, a portion of the closing balance is deposited into the store’s bank account to minimize overnight cash holding.
Example: If ₹6,000 is deposited, ₹2,000 stays with the cashier for the next day.
6. Next Day’s Opening Balance:
The Opening Balance for the next day is the remaining amount after the deposit.
Example: If closing balance was ₹8,000 and ₹6,000 was deposited, the next day’s opening balance will be ₹2,000.
Key Google Sheets Formula Example:
=LEFT_TO_DRAWER + DEPOSIT - CLOSING_BALANCE
= D7346 + D7345 - D7342
Power BI DAX Measure:
Closing Balance =
SUM('CashFlow'[Opening Balance]) +
SUM('CashFlow'[Total Income]) -
SUM('CashFlow'[Total Expenses]) -
SUM('CashFlow'[Deposit])
Business Value:
This dashboard reduces manual errors, increases transparency, and enables instant cash position checks for each store, improving overall financial control.
Tech Stack: Google Sheets, Power BI Desktop, Power Query, DAX.
Visuals:
-
Screenshot 1: Daily Cash Flow Dashboard Overview
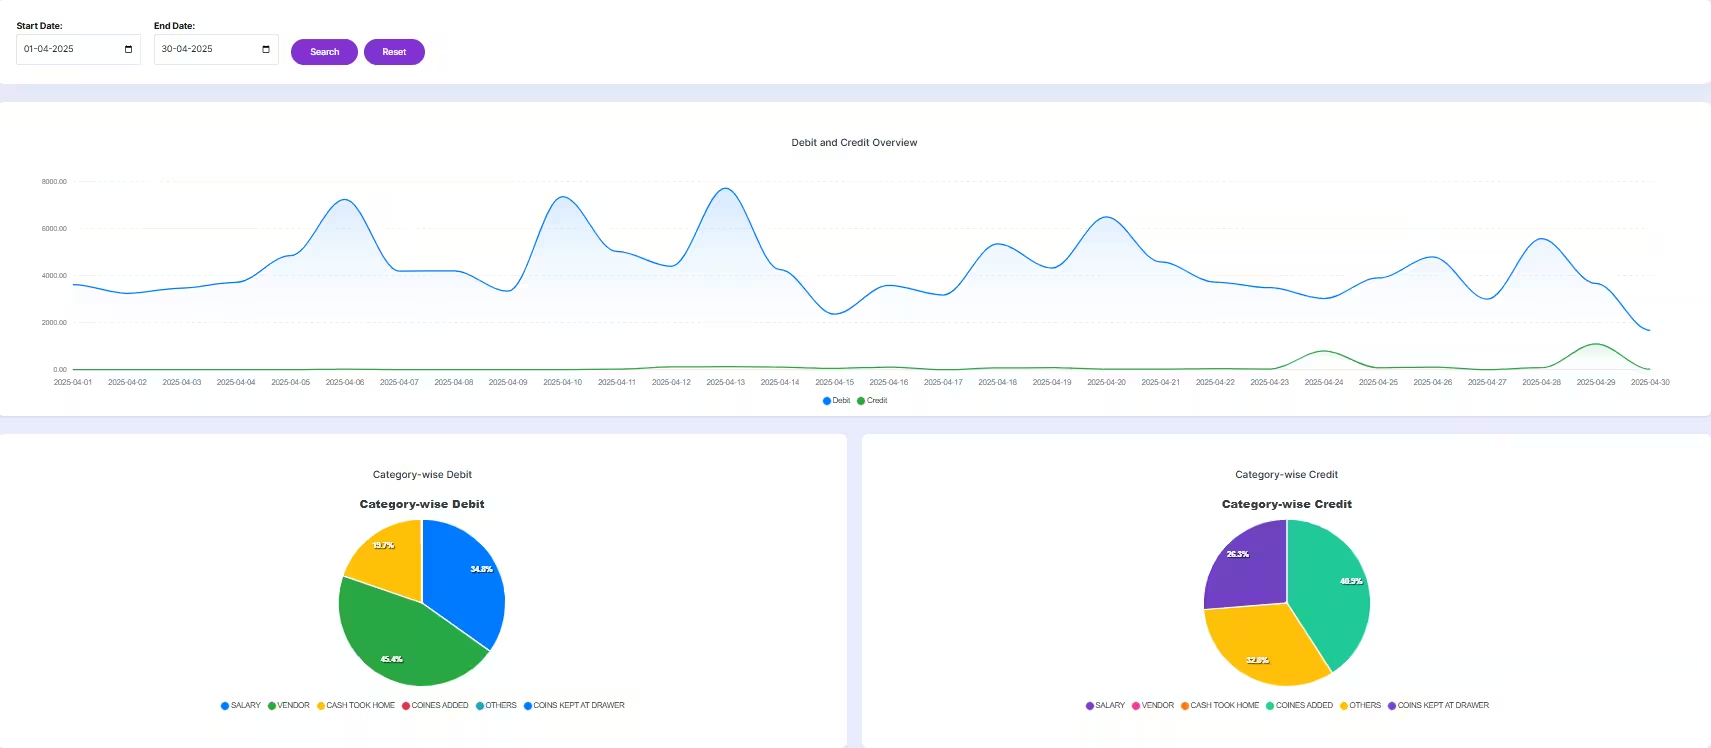
Dashboard: High-level daily cash inflows and outflows for both stores, enabling quick financial insights and decisions.
-
Screenshot 2: Store-wise Cash Summary
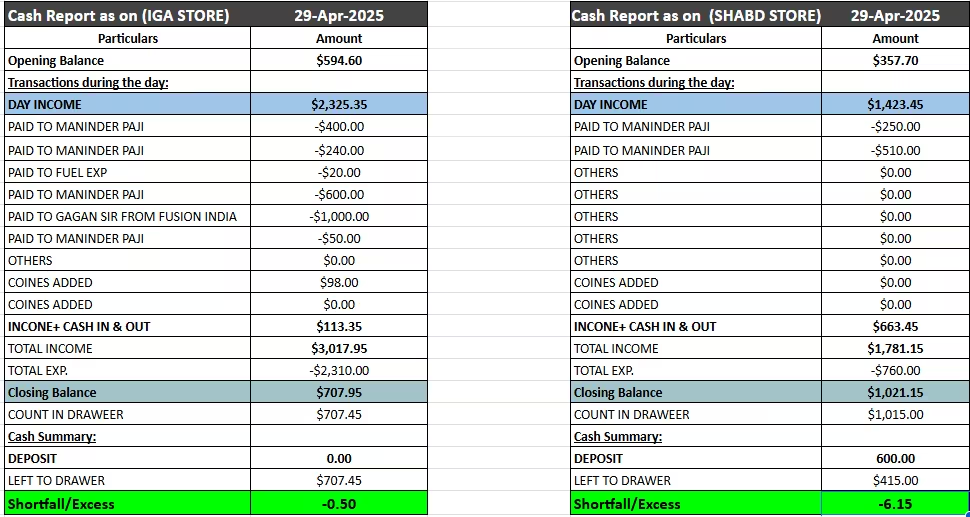
Store summary: Compare cash performance by location, monitor trends, and ensure accuracy across outlets.